tinker-system-monitor
A real-time system monitor plugin for TINKER, tracking CPU, memory, disk and network usage on your computer.
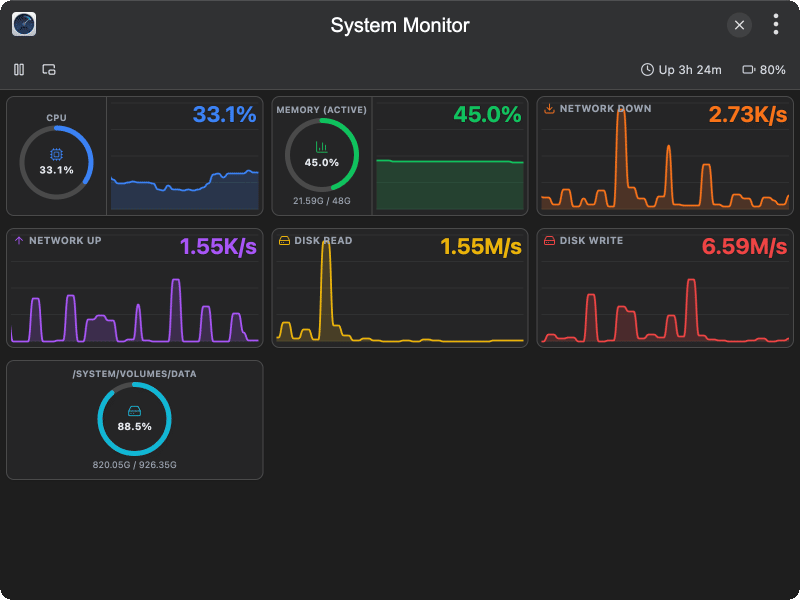
Features
- CPU usage — view real-time CPU load with a percentage ring and history chart
- Memory usage — track active memory consumption against total RAM
- Network throughput — monitor download (RX) and upload (TX) rates
- Disk I/O — display disk read and write speeds
- Disk space — list each mounted volume with size, used capacity, and usage percentage
- Battery status — show battery level when a battery is present
- System uptime — display how long the system has been running
- Pause/resume — pause sampling and resume it at any time
- Floating window — pop the monitor into a small always-on-top window for at-a-glance reading
Usage
- Open the plugin to start collecting metrics — charts populate after a couple of samples
- Watch the CPU, Memory, Network, and Disk I/O panels for live trends
- Scroll down to see disk space for each mounted volume
- Click the Pause button in the toolbar to freeze sampling, click again to resume
- Click the Float button to open a compact floating window with rings for CPU and memory and live network/disk numbers